How to Inspect on Chromebook: A Step-by-Step Guide
Inspecting elements on a webpage is a valuable skill for web developers and designers. If you're using a Chromebook and want to learn how to inspect elements, you've come to the right place. In this article, we will provide a step-by-step guide on how to inspect on a Chromebook, allowing you to explore and manipulate the code and design of web pages.
1. Introduction to Inspecting on Chromebook:

Inspecting on Chromebook
Definition: Inspecting on a Chromebook refers to using the built-in Chrome DevTools to examine and modify the HTML, CSS, and JavaScript code of a webpage.
Benefits: Inspecting allows you to understand how websites are structured, identify and fix issues, and experiment with design changes.
2. Accessing Chrome DevTools:
Method 1: Keyboard shortcut Press "Ctrl + Shift + J" to open the Chrome DevTools panel.
Method 2: Right-click menu Right-click on any part of the webpage and select "Inspect" from the context menu.
3. The Chrome DevTools Interface:
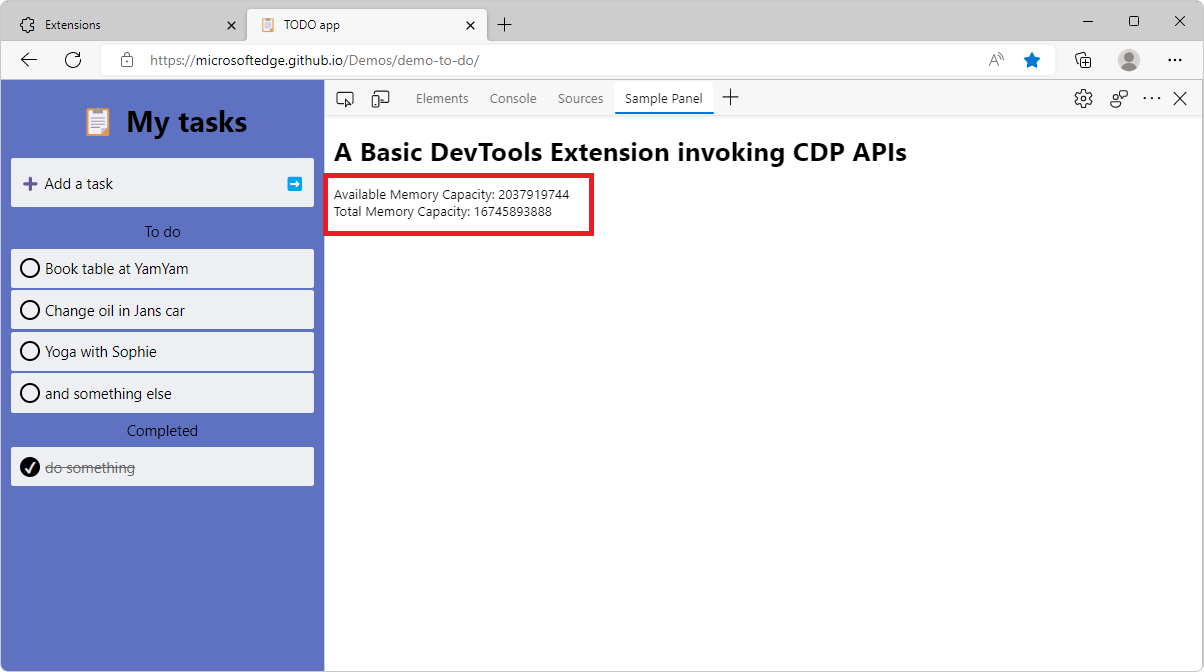
Chrome DevTools Interface
Elements panel: The Elements panel displays the HTML structure of the webpage, allowing you to inspect and modify individual elements.
Styles panel: The Styles panel shows the CSS styles applied to selected elements. You can modify styles and see the changes in real-time.
Console panel: The Console panel provides a JavaScript console where you can test and debug code.
Network panel: The Network panel tracks network requests and provides insights into page loading performance.
And more: Chrome DevTools offers additional panels for auditing, performance analysis, and more.
4. Inspecting Elements:
Selecting elements: Use the mouse pointer to select and highlight specific elements on the page. The corresponding HTML code will be highlighted in the Elements panel.
Viewing element properties: In the Elements panel, you can view and modify various properties of selected elements, such as classes, IDs, styles, and attributes.
Modifying element styles: Experiment with modifying CSS styles in the Styles panel to see how they affect the appearance of the webpage.
5. Additional Features and Tips:
Device mode: Chrome DevTools includes a device mode that allows you to simulate different screen sizes and device types.
Keyboard shortcuts: Familiarize yourself with keyboard shortcuts within Chrome DevTools to enhance your productivity.
Saving changes: Note that any changes made in Chrome DevTools are temporary and only affect your current browser session. To make permanent changes, you need to modify the actual code on the server.
6. Troubleshooting and Debugging:
Console messages: Use the Console panel to view error messages, log outputs, and debug JavaScript code.
Network requests: Analyze network requests in the Network panel to troubleshoot issues related to loading resources.
Inspecting on a Chromebook using Chrome DevTools is a powerful tool for web developers and designers. By following the step-by-step guide provided in this article, you can easily access and navigate Chrome DevTools, inspect and modify elements, experiment with CSS styles, and troubleshoot web page issues. Whether you're a beginner or an experienced developer, mastering the art of inspecting on a Chromebook will greatly enhance your web development skills and allow you to create better, more efficient websites.